Dashboard
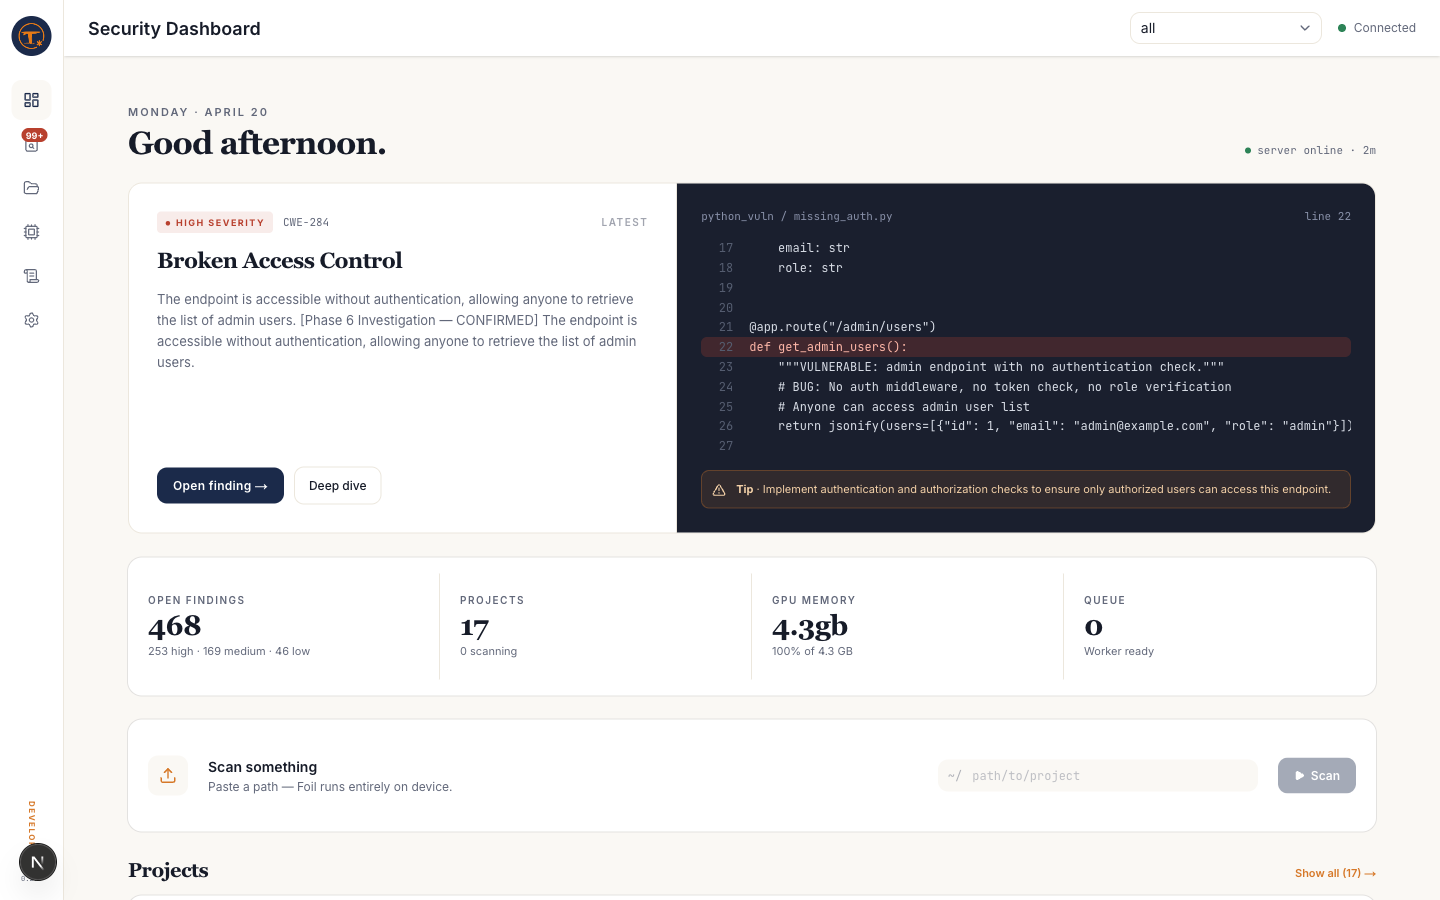
The home page of the dashboard at http://localhost:9090/. It summarises what has happened recently across all projects (or the currently-scoped project).
What you see
- Server status — server up/down, active model, GPU memory use
- Recent scans — the 10–50 most recent scan jobs with status and duration
- Summary cards — counts by severity for the scoped project
- Latest HIGH finding — a featured card for the newest HIGH in the most recently scanned project, so you can jump straight from "I just scanned" to "here's what matters"
What you can do
- Switch project scope with the picker at the top of the left rail —
allaggregates across every registered project - Start a scan from the project picker or directly from a project card
- Jump to findings via the latest-finding card or the severity counts
Notes
- The dashboard polls the server (SWR, 10–30s refresh). If counts seem off after a scan, wait ~15s or reload.
- If no scan history is present, the dashboard shows the onboarding variant with a "Register a project" call to action.